Tesla shares are currently down 75% since the all-time high. This is the time to become interested in long term opportunities, not to run away from the market.
In this write up we will go over some simple technical facts for the TSLA chart and we will look at a swing trading strategy on the three day timeframe that has not failed to deliver insane profits in the past for this stock.
1. RSI is coming to extremely oversold conditions
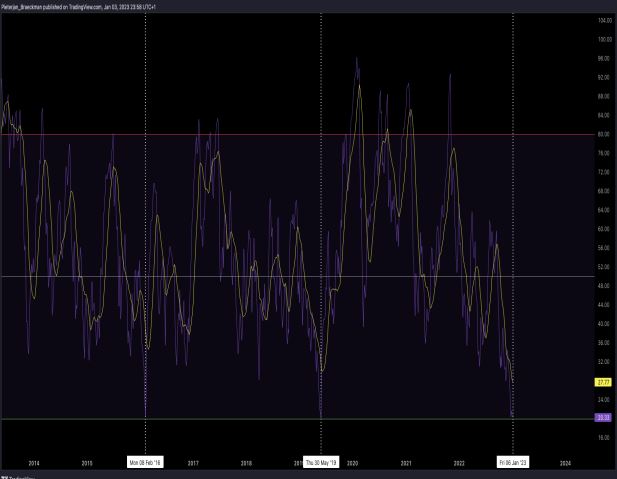
This is a view of the three-day timeframe RSI for TSLA.
Essentially TSLA is currently coming to the “20” level on the three-day RSI, which is something that has only happened twice before: in February 2016 and in May 2019.
Both times in history, a three-day timeframe RSI around 20 has signified bottoms for TSLA.
Coming from the oversold conditions in February 2016, Tesla rallied 91% before getting a first (small) pullback, but ultimately held the low that was printed on price when the three-day RSI bottomed out.
In May 2019, the three-day RSI dropped below 20 and equally marked the bottom on price. From there, Tesla entered a massive bull run.
For the third time in history now, we find ourselves for Tesla at the 20 level on the three-day RSI. Knowing what happened during the first two times that Tesla hit this specific level on the three-day RSI, we recognize that it is a strong indication for an upcoming long play.
With this information in mind, we can now look for some confluence to the fact that we are in fact approaching a bottom for Tesla.
2. Tesla is nearing completion of a massive head and shoulders breakdown pattern
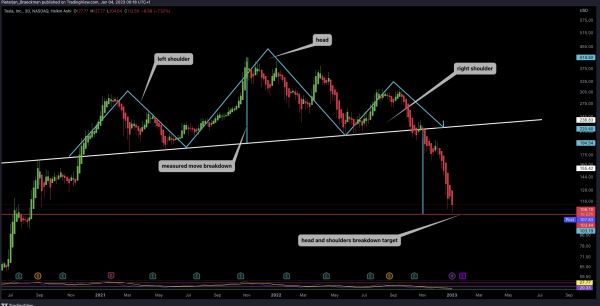
Still, on the three-day timeframe, Tesla has formed a massive head and shoulders pattern.
Head and shoulders patterns are bearish patterns with a clear breakdown target.
After breaking the neckline, we have been trading to a technical target around the $105 level as an ultimate target from this head and shoulders pattern.
This means that technically speaking, Tesla should be nearing completion of the breakdown from this pattern. (technical target is the distance from the head to the neckline, after breaking the neckline, the distance from the head to the neckline determines the breakdown target).
The fact that we are reaching the measured move breakdown target for Tesla gives us confluence to the fact that we are indeed very likely coming to a bottom area.
Now that we have two strong indications that Tesla is nearing a bottom, let’s take a look at the ultimate CONFIRMATION signal that we can look for in order to enter a swing long position.
3. Waiting for the three-day RSI to break above the 14 MA.
In order to finalize our trading plan for Tesla we can take a look at the following confirmation statement for us to enter a swing long position: the three-day RSI needs to break above the 14 MA.
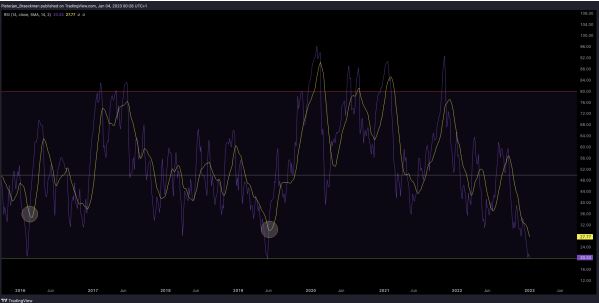
On the RSI, you can clearly see a yellow line, this yellow line is the 14 SMA.
A simple confirmation for entering a swing long position is made when the RSI (purple line) crosses above the 14 SMA on the three-day timeframe after having hit the 20 mark.
From that point on, a swing long position could be entered with a stop loss on the low that was created when the RSI bottomed out.
Historically speaking, this has not failed to deliver an insane profit potential.
Stayed tuned to the Pennybois discord to get updated when this signal flashes and make sure to go over this swing trading three-day RSI setup for different stocks yourself!


