Bollinger Bands 101
I’m Meta Matt, Director of Education and welcome to PB University LITE! This is a 50 Class Trading 101 Series geared towards both new and veteran traders alike! We go over everything from Trading Psychology, Technical Analysis, and Options Trading to Commodity Trading, Forex, and more!! This 50 Class series is not designed be taken in order, it is instead designed for traders to browse and pick which classes interest them. I will include the list of classes at the bottom of this page.
Start Trading With Webull: Free Stock Shares
Custom Trading Indicator DISCOUNT: Try StocksBuddy Today
Get A Trading Coach, Premium Alerts, Education, and Community:
1 Month Membership
90 Days (Save 10% Per Month)
1 Year (Save $279)
Envisioning Bollinger Bands
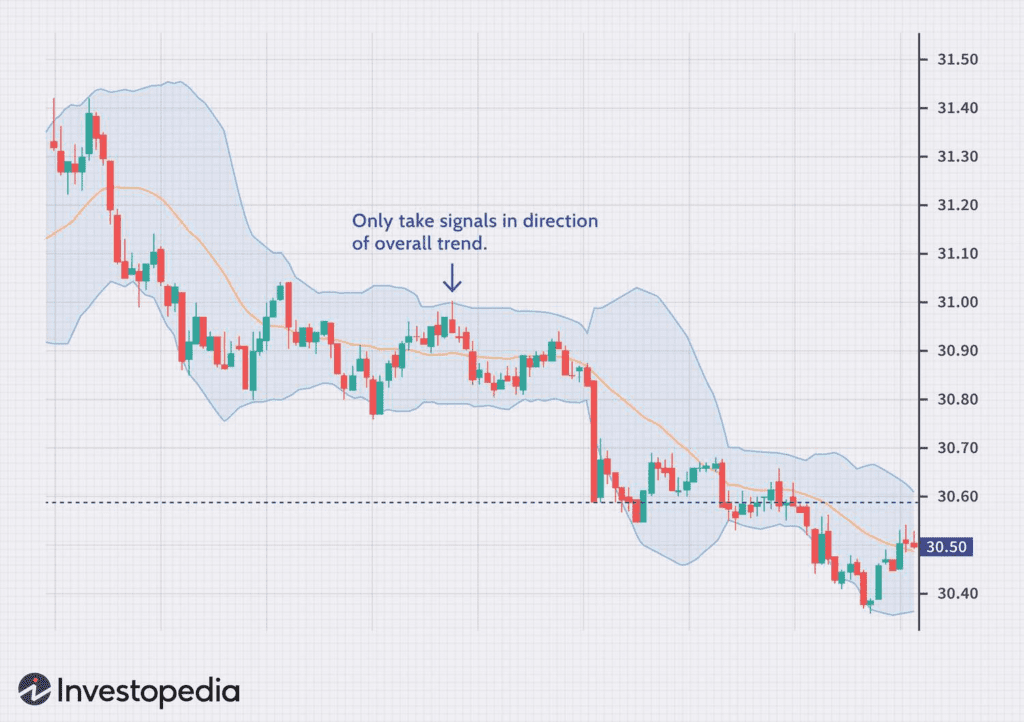
Imagine a price chart adorned with three lines: an upper band, a lower band, and a middle band. These dynamic bands aren't randomly placed; they're meticulously calculated based on the underlying asset's price volatility. The centermost band is typically a 20-period simple moving average, essentially reflecting the average price over the past 20 periods. The upper and lower bands are positioned two standard deviations away from the middle band.
Decoding the Message: Volatility and Price
By observing the price movement within these Bollinger Bands, we gain valuable insights:
- Narrow Bands: Confined prices within the bands suggest low volatility. This might indicate consolidation or a controlled trend.
- Expanding Bands: Widening bands signal increasing volatility, potentially preceding significant price swings. Conversely, contracting bands suggest decreasing volatility.
- Price Touching the Bands: A price brushing against the upper Bollinger Band suggests a possible overbought condition, whereas a touch of the lower band hints at a potentially oversold market.
Trading Strategies with Bollinger Bands:
Bollinger Bands open doors to various trading strategies:
- Mean Reversion Trading: Based on the idea that prices tend to revert to their average (middle line), traders might enter contrarian positions when prices reach the bands, anticipating a move back towards the moving average.
- Breakout Trading: Breakouts occur when prices decisively move outside the Bollinger Bands, potentially signaling significant price movements and breakout trade opportunities.
Beyond Bollinger Bands: Combining Indicators for Clarity
Remember, Bollinger Bands are just one piece of the puzzle. To strengthen your analysis, consider using them alongside other indicators:
- Confirmation: A sustained price move above the upper Bollinger Band accompanied by bullish signals from other indicators can reinforce a bullish trend.
Remember: The Bollinger Band Disclaimer
While Bollinger Bands are a powerful tool, they have limitations:
- Lagging Indicator: They react to past price movements, potentially leading to false signals in volatile markets.
- False Signals: In some cases, large market participants might manipulate Bollinger Bands to trap traders and create misleading signals.
The Takeaway: Bollinger Bands - A Partner, Not a Solo Act
Bollinger Bands are a versatile tool, offering valuable insights into volatility, potential turning points, and trading opportunities. By understanding their application, interpretation, and limitations, you can effectively incorporate them into your trading strategies and make informed decisions.
Remember, no single indicator guarantees success. A comprehensive approach that combines technical analysis, like Bollinger Bands, with fundamental analysis is key for navigating the complexities of the market.

PB University LITE Class List
1) Trading Terminology
2) Stock Market Indices
3) Common, Preferred, and Penny Stocks
4) Diversification of Assets
5) Fundamental Analysis Made Easy
6) Technical Analysis Made Easy
7) Risk Management In The Market
8) Portfolio Management
9) How To Follow Market News
10) Trading Psychology
11) Options Explained
12) The Greeks In Options Trading
13) How To Short Sell Options
14) Covered CALLS
15) Spread Trading
16) Online Brokers for Options Trading
17) Implied Volatility Calculators & Tools
18) Protective PUTS
19) Iron Condors
20) Straddles
21) Reading Level 2
22) Taxes
23) Trading Psychology Techniques
24) The Art Of Trading
25) Becoming A Jedi In The Stock Market
26) Futures Trading Explained
27) Commodity Trading 101
28) Regulatory Environments
29) How To Become A Millionaire
30) $100K In 100 Days
31) Wash Sale Rule
32) Behavioral Finance Part 1
33) Behavioral Finance Part 2
34) 5 Charting Indicators
35) Fair Value Gap
36) Insider Trading and Market Manipulation
37) Stock Chart Types
38) Moving Averages 101
39) Base vs Precious Metals
40) Electricity Trading 101
41) Trading Brokers 101
42) 5 Trading Strategies
43) 85% Trading Rule
44) Are Win Rates A Scam?
45) Futures Trading 101
46) ATR Indicator Strategy With The Greeks
47) MACD Indicator 101
48) Bollinger Bands Indicator 101
49) Wedges, Triangles, Flags and Pennants
50) RSI Divergence 101


