JUNE 22 - JUNE 26, 2026
Major Market Notes
Stocks closed last week higher despite a midweek jolt — the Nasdaq gained 2.43% and the S&P 500 0.93%, even as Kevin Warsh's first meeting as Fed chair turned hawkish: rates held at 3.50%–3.75%, but the dot plot showed nine of eighteen officials now expecting at least one 2026 hike, and the S&P logged its worst "Fed day" under a new chair since 1994 before recovering Thursday and closing Friday for Juneteenth.
The dominant overhang carrying through the weekend is energy: even with the U.S.–Iran ceasefire reopening the Strait of Hormuz, the U.S. Strategic Petroleum Reserve has dropped to a roughly three-year low near 349 million barrels and is draining close to 9 million barrels a week toward its lowest level since 1983, with Exxon warning that Brent could spike to $150–$160 once inventories hit lows.
The week ahead is AI-chip heavy — Cerebras (CBRS) posts its first report since its May IPO on Tuesday after the close, with the Street expecting a roughly $0.14 loss on about $57 million in revenue, and Micron (MU) reports fiscal Q3 on Wednesday after the close, where consensus near $34.5 billion in revenue and roughly 900%+ EPS growth will test whether the high-bandwidth memory boom — sold out through 2026 — can keep running.
Also on the radar: Qualcomm's June 24 investor day and the May PCE print later in the week, the Fed's preferred inflation gauge, which carries extra weight now that the committee has turned more hawkish.
Events & Livestream Schedule

Upcoming Earnings Releases

Economic Calendar

Broad Market Analysis
/SPX500USD: SP500

- The SP500 pushed higher last week after it put in a nice new potential higher low the previous week, which could result in higher prices in the near term.
- As long as the SP500 holds $7350 on the weekly and daily time frames going forward, expect the SP500 to drift higher to retest resistance above at $7600-$7640.
- Anything above $7640 and expect the SP500 to make new all time highs and continue running up to $7750/$8000 in the future.
- If $7350 cannot hold as support this week, look for a move lower down to $7030-$7000 support below, which also is the previous all time high.
$S5FI: SP500 Stocks Above 50-Day Average

- Short term breadth got rejected off of 65% resistance last week and closed right at major support of 55% to end the week.
- With that, if 55% can hold as support in the future, look for a retest of 65% in the future.
- Anything over 65% and expect a move to 72.50%/75% in the future.
- If 55% cannot hold as support, look for a move down to 45% to test the low of trend.
- Anything below 45% and expect a move to 40%/35%/30% in the future.
$S5TH: SP500 Stocks Above 200-Day Average

- Long term breadth also got rejected off resistance at 60%, which is a key level for long term breadth going forward.
- If 60% remains as resistance, look for a move down to 50%/45%/42.50% in the future.
- If 60% can be broken and held as support, look for a move to 65%. Anything over 65% and expect a move to 70%/75% in the future.
$US30: Dow Jones Industrial Average

- The Dow pushed higher last week but failed to move higher above $52000. With that, it is still at its highest weekly candle close of all time.
- For this week, if $50000 can continue to hold as support, look for a move higher to $51500/$52000/$52500/etc.
- If $50000 cannot hold as support in the future, look for a move lower down to $48000/$47000/$45000 in the future.
$IXIC: Nasdaq Composite

- The Nasdaq gapped up last week above $26350 and also managed to close over it, which is a good sign for the bulls as long as $26350 can hold.
- If the Nasdaq can hold $26350 this week, look for a move to $27000. Anything over $27000 and expect a move to $27500/$28000/$28500/etc.
- If $26350 fails to hold as support in the future, look for a move lower down to $25000.
- Anything below $25000 and expect a move to $24000/$23750 in the future.
$US2000: Russell 2000

- The Russell tapped $3000 last week for the first time ever, which is incredible for small caps as it continues to push higher here.
- With that, if $2900 can hold as support going forward, look for a move higher to $3000/$3100/$3200 in the future.
- If $2900 cannot hold as support in the future, look for a retest of $2800.
- Anything below $2800 and expect a move to $2730-$2700.
- Anything below $2700 and expect a major move lower down to $2600/$2500 in the future.
$VIX: Volatility Index
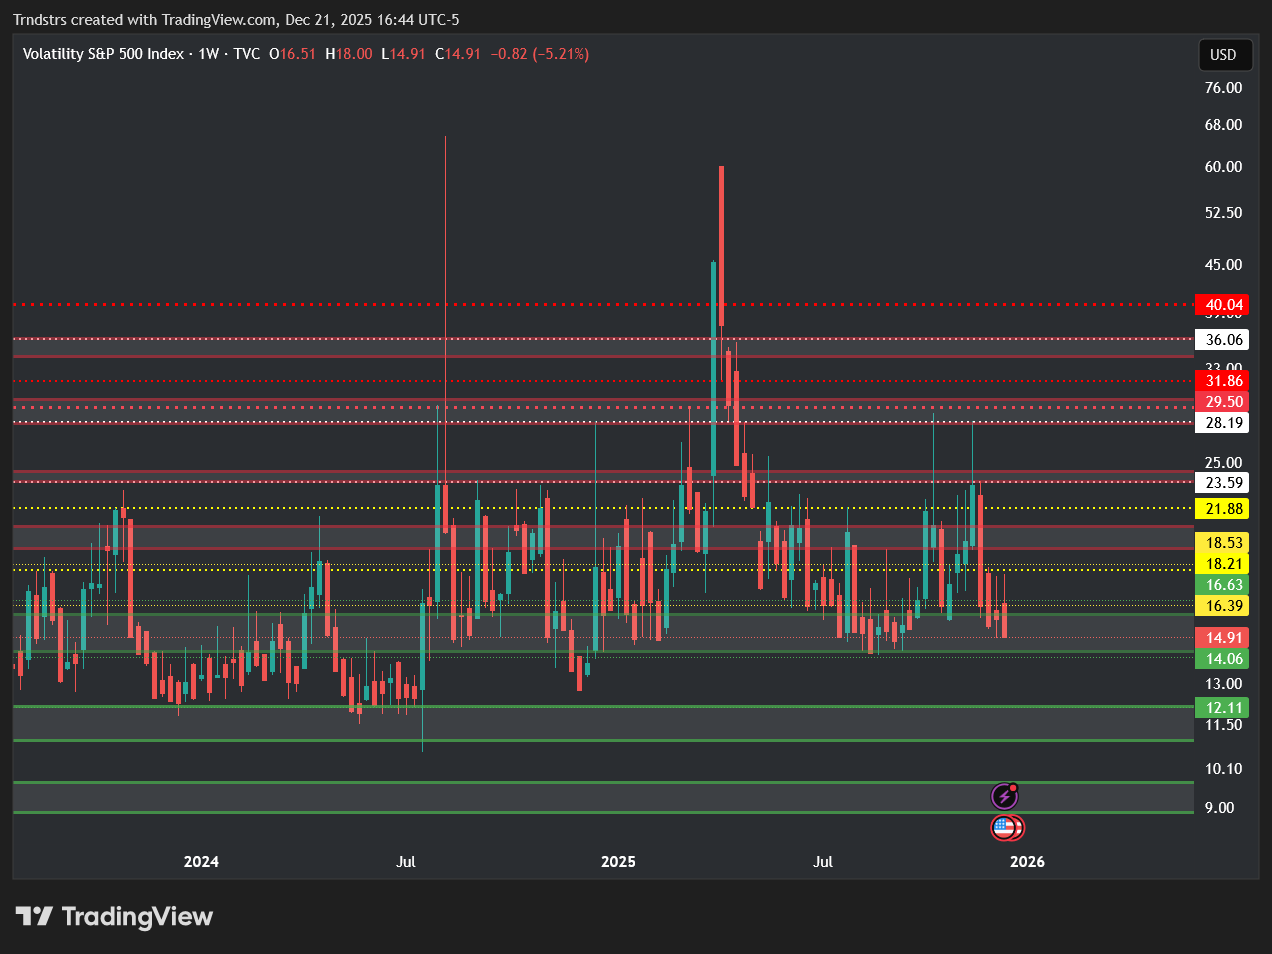
- The VIX failed to break over $18 resistance last week, but it also closed right at $16 support to end the week.
- If $16 can hold as support this week, look for a retest of $18.
- Anything over $18 and expect a move to $20/$23.50 in the future.
- If $16 cannot hold as support, look for a move down to $14/$12 in the future.
$XAUUSD: Spot Gold

- Gold gapped up last week but got rejected from $4400 resistance, which prompted it to move lower into the end of the week.
- With that, if $4400 remains as resistance in the future, look for a move down to $4000 in the future.
- Anything below $4000 and expect a move to $3750/$3500/$3250 in the future.
- If $4200 can be reclaimed as support, look for a move to $4400.
- Anything above $4400 and expect a move to $4500/$4750 in the future.
$XAGUSD: Spot Silver

- Silver got rejected from $70 resistance last week and closed right at major support of $65 to end the week.
- With that, if $70 holds as resistance in the future, look for a move lower down to $65/$60 to retest those levels in the future.
- If $60 cannot hold as support, expect a larger move down to $55/$50/$47.50 in the future.
- If $70 can be broken and held as support, look for a move to $75 in the future.
- Anything above $75 and expect a move to $80/$85 as well.
$DXY: US Dollar Index

- The US Dollar finally managed to break over $100 resistance last week, with a nice higher high to make the micro trend here even more bullish than before.
- For this week, if $100 can hold as support, look for a move to $101/$102/$103 in the future.
- If $100 cannot hold as support, look for a move to $98/$96 in the future to test the lows of trend.
$USOIL: Crude Oil

- Crude Oil had a major breakdown last week after it gapped below major support at $85, with a close down near $75 to end the week.
- With that, if $75 can hold as support in the future, look for a move up to $80/$82.50/$85 in the future.
- If $75 cannot hold as support in the future, look for a move down to $72.50/$70/$67.50 in the future.
- $67.50 is the key support to watch going forward for Crude Oil.
- If that level is lost, expect a major bearish breakdown in the future.
$US02Y: US Government Bonds - 2-Year Yield

- The 2-Year managed to hold 4% as support last week and close right at 4.15%-4.30% resistance to end the week.
- If 4% can continue to hold as support and 4.15% can be held as support as well, look for a move to 4.30%.
- Anything above 4.30% and expect a move to 4.50%/4.60% in the future.
- If 4% cannot hold as support in the future, look for a move down to 3.80%/3.60%/3.40% in the future.
$US10Y: US Government Bonds - 10-Year Yield

- The 10-Year is sitting in the relatively same spot as last week, with a close right under 4.50% to end the week.
- With that, if 4.50% can be broken, look for a move to 4.60%. Anything above 4.60% and expect a move to 4.80%/5% in the future.
- If 4.50% remains as resistance in the future, look for a move lower down to 4.30%-4.20%.
- Anything below 4.20% and expect a move to 4.10%/4%/3.90% in the future as well.
Get Three In-Depth Research Reports Every Month
Rest & Retire provides busy investors with three in-depth research reports directly to your inbox every month.
Technical Analysis
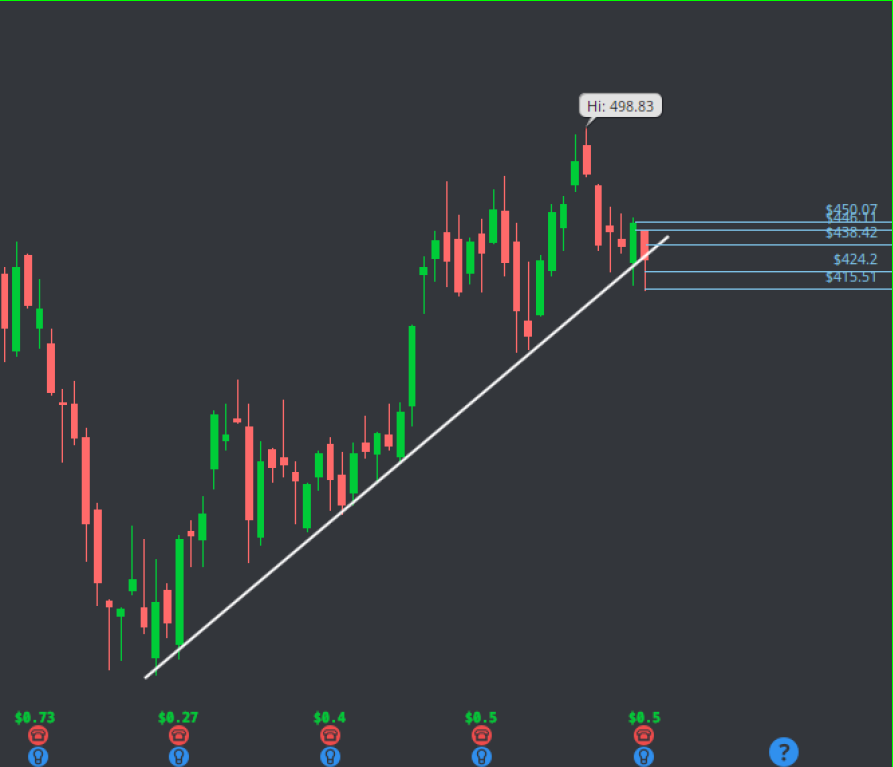
$TSLA: Tesla
- This might be the best-looking setup headed into the week.
- We’ve got a beautiful trendline resistance to monitor for a breakout on the daily.
- We’ve got a recent retest of our macro trendline support near $390, and the Thursday Daily candle was absolutely beautiful with a STRONG failure to go lower candle showing.
- We have key levels between $404.5 and $407, if we see acceptance above this zone, then we could retest key levels near $411.4 and $412.3, at which point we are poised to test our real target near $420.7 / $424.
- There is plenty of room higher towards $430 / $435 / $440, but we want to be realistic.
- If we lose support at $394.20, we’ll look for a bounce near $386 / $385.
$QCOM: Qualcomm
- I don’t really have a pattern here, which is atypical, but I love the April / May price action, and we’re seeing an inside bar at the moment on this June monthly candle.
- Could be a sign that we’ll get a 1-2-3 bar play setup headed into July, or this “inside bar” candle could close at $260 and close green for all we know, but the action has been very bullish, and we’ve just seen a very healthy pullback after such an impressive move.
- We’re looking for acceptance over $229. If we can see that we have levels to retest near $235, $240, and $245.75 before we test higher around $249.5 / $251.75 / $255 / $260.
- We have support at $220.50 and $222, if we lose that zone, we could retest lower levels near $194.11 and $189.
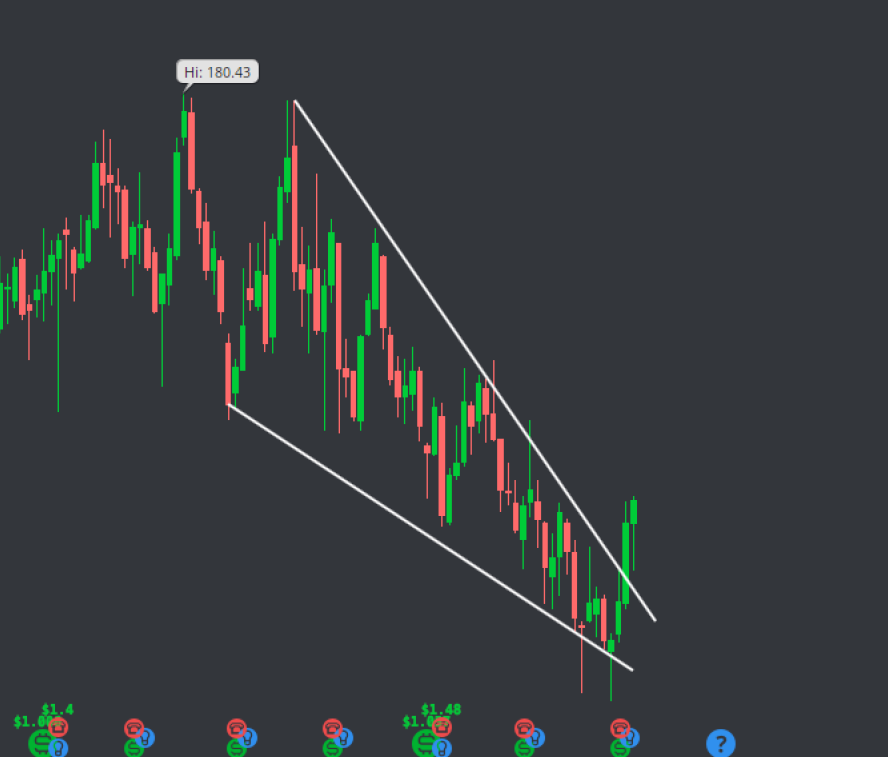
$SHOP: Shopify
- I feel like this setup still needs some time, but we're keeping our eyes on $SHOP for this weekly/daily falling wedge pattern.
- It needs acceptance over $114 / $115 to break out, and I don’t really feel like getting caught in the chop until that happens.
- If we somehow gap up over $115 this week and trigger that, we have levels near $116.5 and $117.7 to watch before our next targets of $120.8 and $124.20.
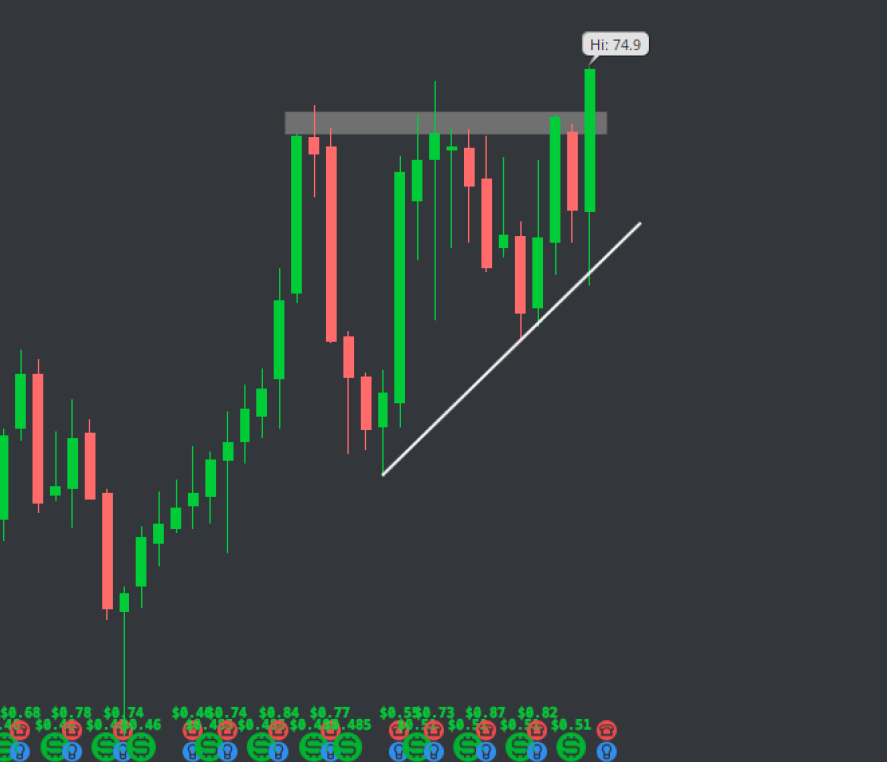
$CRWV: Coreweave
- We caught a nasty breakout on this near $82, and thought maybe it might have just been a dead cat bounce, but we are seeing some LIFE out of Coreweave again.
- This weekly chart looks very nice if we can get acceptance over this little period of consolidation.
- Specifically, we’re looking for acceptance over $120.34 as a trigger.
- We’ve got levels near $124 and $130 to use as quick targets, and more levels near $132.2, $136.40, $140, and $148 if we see some solid strength out of this setup.
- If we lose support around $115.7, then we could retest lower levels near $108 and $104.
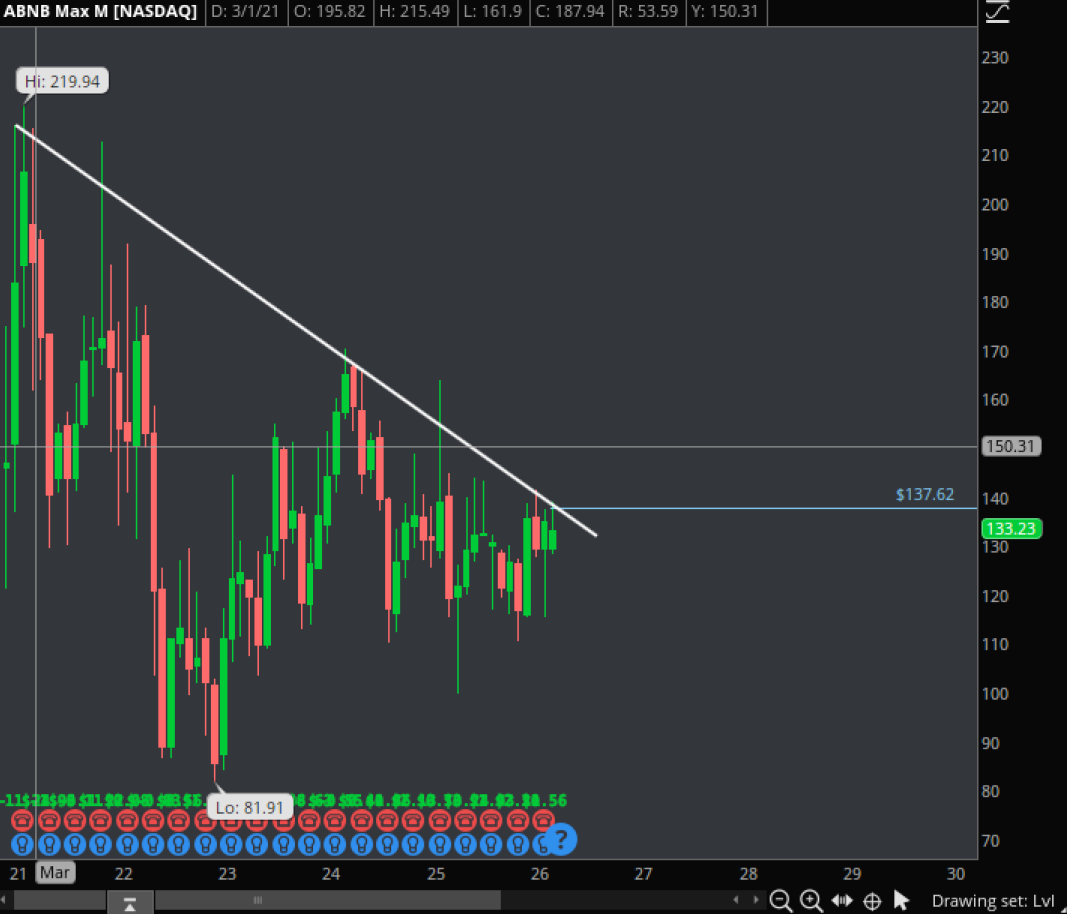
$ABNB: Airbnb
- I may have given up on this setup too early.
- If you’re new here, we’ve been waiting on this monthly trendline breakout on ABNB for probably 6 months now, and cut our position recently.
- I’m going to re-allocate a small position in case we break out.
- Not much to this setup. Don’t need to get very technical.
- Fundamentally speaking, there is no reason for a giant reversal on the Uber of real estate, but this flag is 5+ years in the making, and crazier breakouts have occurred.
- Will cut my shares below $120’s if we start to sell off.
$DAVE: Dave Financial
- We’ve trimmed about 60% of our position on DAVE.
- Our initial entry was just above $220, with some more shares scooped up around $270, and we got out around $310.
- Absolutely great swing trade so far, and we plan on holding the rest of the shares for the long haul with stops around break-even.
- We’re back in uncharted territory on DAVE, the R/R is shifting up here, and we don’t have any patterns or key levels to help guide us.
- All of that said. This is a VERY strong-looking chart on higher time frames, and we trust that we’ll see some bullish continuation from these breakouts.
$INTC: Intel
- While we’re on the topic of stocks near ATH after parabolic runs that are in uncharted territory… *cough*... let's take a look at this beautiful weekly setup on INTC!
- The weekly looks great, with a nice hammer over consolidation.
- We’ve got some key levels around $128.5 to $126.75.
- If we’re lucky enough to get a pullback to this zone, then we could look for acceptance / a trim near $135, then hold for some psychological numbers like $137.50 / $140 / $142.50 / $145, etc.
- If we slip from that zone, we have lower levels near $122.3 and $121.75 to watch for a bounce.
- Either way, this is a bullish momentum play.
- Just a matter of whether we trigger right out of the gate on Monday or if we start with a bit of a pullback, which really makes this a favorable setup from an R multiple perspective.
Get Our Weekly Watchlist
Get the latest market news, stocks to watch, earning reports, exclusive discounts and more!
PB Alerts is a group of experienced traders dedicated to providing hedge fund quality trade alerts without the cost.