RSI Divergence 101
I’m Meta Matt, Director of Education and welcome to PB University LITE! This is a 50 Class Trading 101 Series geared towards both new and veteran traders alike! We go over everything from Trading Psychology, Technical Analysis, and Options Trading to Commodity Trading, Forex, and more!! This 50 Class series is not designed be taken in order, it is instead designed for traders to browse and pick which classes interest them. I will include the list of classes at the bottom of this page.
Start Trading With Webull: Free Stock Shares
Custom Trading Indicator DISCOUNT: Try StocksBuddy Today
Get A Trading Coach, Premium Alerts, Education, and Community:
1 Month Membership
90 Days (Save 10% Per Month)
1 Year (Save $279)
Understanding RSI Divergence
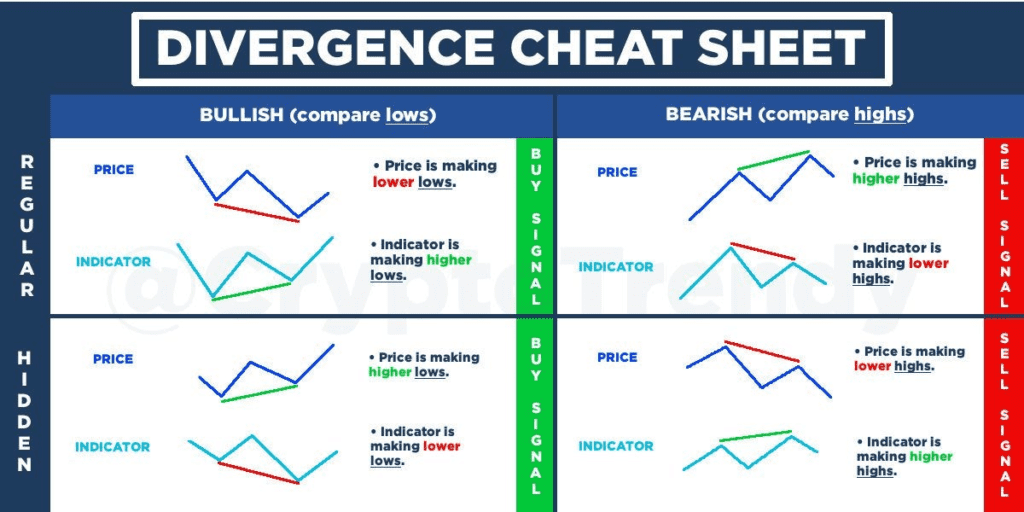
RSI Divergence occurs when the Relative Strength Index (RSI) indicator and the price chart move in opposite directions. This mismatch can suggest a weakening of the current trend and a possible reversal.
Regular (Strong) Divergence
- Bullish Divergence: Price makes lower lows, while the RSI forms higher lows. This suggests the downtrend might be losing momentum, hinting at a potential bullish reversal.
- Bearish Divergence: Price creates higher highs, but the RSI forms lower highs. This indicates the uptrend might be weakening, suggesting a possible bearish reversal.
The Rationale Behind RSI Divergence
During an uptrend, if both the RSI and the price move up in tandem, it reflects strength in the uptrend. However, when they diverge, with the RSI failing to confirm the price movement, it can signal a loss of momentum in the current trend.
Variations of Divergence
- Medium/Exaggerated Divergence:
- Bullish: Price forms equal lows (double bottom), while the RSI makes higher lows.
- Bearish: Price forms equal highs (double top), while the RSI makes lower highs.
- Weak Divergence:
- Bullish: Price makes lower lows, and the RSI makes equal lows.
- Bearish: Price makes higher highs, and the RSI makes equal highs.
- Hidden Divergence (Continuation Signal):
- Bullish: Price makes higher lows, but the RSI makes lower lows.
- Bearish: Price makes lower lows, but the RSI makes higher lows. (Note: This suggests a continuation of the current trend.)
Tips and Considerations
- Some traders prefer line charts for easier identification of highs and lows when spotting divergence.
- Remember, RSI Divergence is a suggestive tool, not a definitive guarantee of a reversal.

PB University LITE Class List
1) Trading Terminology
2) Stock Market Indices
3) Common, Preferred, and Penny Stocks
4) Diversification of Assets
5) Fundamental Analysis Made Easy
6) Technical Analysis Made Easy
7) Risk Management In The Market
8) Portfolio Management
9) How To Follow Market News
10) Trading Psychology
11) Options Explained
12) The Greeks In Options Trading
13) How To Short Sell Options
14) Covered CALLS
15) Spread Trading
16) Online Brokers for Options Trading
17) Implied Volatility Calculators & Tools
18) Protective PUTS
19) Iron Condors
20) Straddles
21) Reading Level 2
22) Taxes
23) Trading Psychology Techniques
24) The Art Of Trading
25) Becoming A Jedi In The Stock Market
26) Futures Trading Explained
27) Commodity Trading 101
28) Regulatory Environments
29) How To Become A Millionaire
30) $100K In 100 Days
31) Wash Sale Rule
32) Behavioral Finance Part 1
33) Behavioral Finance Part 2
34) 5 Charting Indicators
35) Fair Value Gap
36) Insider Trading and Market Manipulation
37) Stock Chart Types
38) Moving Averages 101
39) Base vs Precious Metals
40) Electricity Trading 101
41) Trading Brokers 101
42) 5 Trading Strategies
43) 85% Trading Rule
44) Are Win Rates A Scam?
45) Futures Trading 101
46) ATR Indicator Strategy With The Greeks
47) MACD Indicator 101
48) Bollinger Bands Indicator 101
49) Wedges, Triangles, Flags and Pennants
50) RSI Divergence 101


