Module 1: Introduction to the Stock Market
How Stock Prices Move
Lesson 2: By the end of this class, you will understand what drives stock prices, the main players in the market, and how different orders influence the movement of prices.

What Do Most Traders Get Wrong About
Supply & Demand?
At its core, a stock’s price is determined by supply and demand. If more people want to buy a stock than sell it, the price goes up. If more people want to sell than buy, the price goes down. That itself seems like a simple concept, but because of this simplicity, it often leads to a significant misunderstanding of how price action actually works.
Stock prices are constantly adjusting to find a balance between buyers and sellers. However, every buyer has a seller and every seller has a buyer. This equal and opposite matching is what MUST happen in order for shares and cash to change hands in the market. Let's break it down logically, you couldn't go to a car dealership and get a car for nothing, and it wouldn't make sense for you to give them your cash without anything in return, right? The stock market is no different. We see orders matched in real-time, and every one of those orders has a buyer and a seller, otherwise it wouldn't exist.

What's actually happening under the hood at the exchange, is that one order is the dominant order and one is the lesser order, and price moves based on whether or not the dominant order is on the bid or the ask. The dominant order reaches across the bid/ask spread and finds it's match and the transaction is fulfilled. One person walks away with cash and the other walks away with shares, and then the bid/ask is adjusted to reflect the newly updated set of orders which haven't yet been matched for the next cycle of matching orders. Sometimes this moves the price up, sometimes it moves the price down.
This happens every second of the trading day, which is why prices can move quickly or slowly depending on how many people are trading and how active they are. The term which describes how available cash & shares are to trade is "liquidity". When a stock has high liquidity, it means the orders are much easier to fill because the matching can happen at a higher frequency than a lower liquidity stock. We will dive into this concept later, but it is important to understand as a general concept.
How Do We Know
Who Is In The Market?
There are several types of participants in the market, each playing a different role:
Retail traders
These are individual investors like you and me. We trade using brokerage accounts and often focus on smaller positions.
Institutional Traders
Hedge funds, mutual funds, and pension funds fall into this category. They manage large amounts of money and their trades can move markets.
Market Makers
These firms provide liquidity by always posting buy and sell quotes. They help ensure that if you want to buy or sell a stock, there is usually someone on the other side of the trade.
How Do We Know
Understanding Bid, Ask, and Spread
Every stock has a bid and an ask price. The bid is the highest price someone is willing to pay, and the ask is the lowest price someone is willing to sell.
The spread is the difference between the two. A smaller spread usually means the stock is more liquid and trades easily. A wider spread can indicate less activity or more risk in executing trades.
Time & Sales, and the Order Book (Level 2)
Time and Sales shows actual completed trades, including price, volume, and time. Watching it helps you see real market activity.
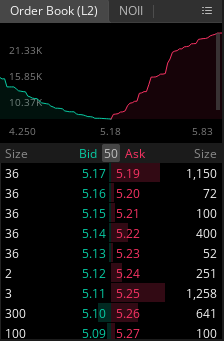
Level 2 displays open buy and sell orders at different price levels. It allows you to see the order flow and the depth of the market, giving insight into potential price movements.

Not A Member Yet?
Not A Problem!
Here Are Some
Chart Types You Should Know About
Charts help you visualize price movements. You don’t need to master them yet, but it’s good to know the main types (we will learn about each more in-depth later!). They all represent data, but in different ways:
Line
Candlestick
Hollow Candlestick
Bar/Colored Bar
Heikin-Ashi
Baseline
PB Alerts is a group of experienced traders dedicated to providing hedge fund quality trade alerts without the cost.