Fundamental Analysis Made Easy
I’m Meta Matt, Director of Education and welcome to PB University LITE! This is a 50 Class Trading 101 Series geared towards both new and veteran traders alike! We go over everything from Trading Psychology, Technical Analysis, and Options Trading to Commodity Trading, Forex, and more!! This 50 Class series is not designed be taken in order, it is instead designed for traders to browse and pick which classes interest them. I will include the list of classes at the bottom of this page.
Start Trading With Webull: Free Stock Shares
Custom Trading Indicator DISCOUNT: Try StocksBuddy Today
Get A Trading Coach, Premium Alerts, Education, and Community:
1 Month Membership
90 Days (Save 10% Per Month)
1 Year (Save $279)
Fundamental Analysis is a method of evaluating a company's financial health and potential for future growth by analyzing its financial statements and other business metrics. Basically, we're trying to see if the company is making money, if they're in debt, and if they have the potential to make more money in the future. We start by looking at the company's income statement, balance sheet, and cash flow statement. These documents will give us an idea of how much money the company is making, how much they're spending, and how much they have in the bank.
A company's Income sheet is kind of like a report card for a business, it shows you how much money they made, how much they spent, and how much they have left over. It’s like when you make your own budget, you're comparing your income vs how much you spent, and then how much is left over. If it doesn’t add up, chances are you got drunk a few nights and spent more cash than you remember at the local bar. Or in a company's case, investors want to know where that money went.
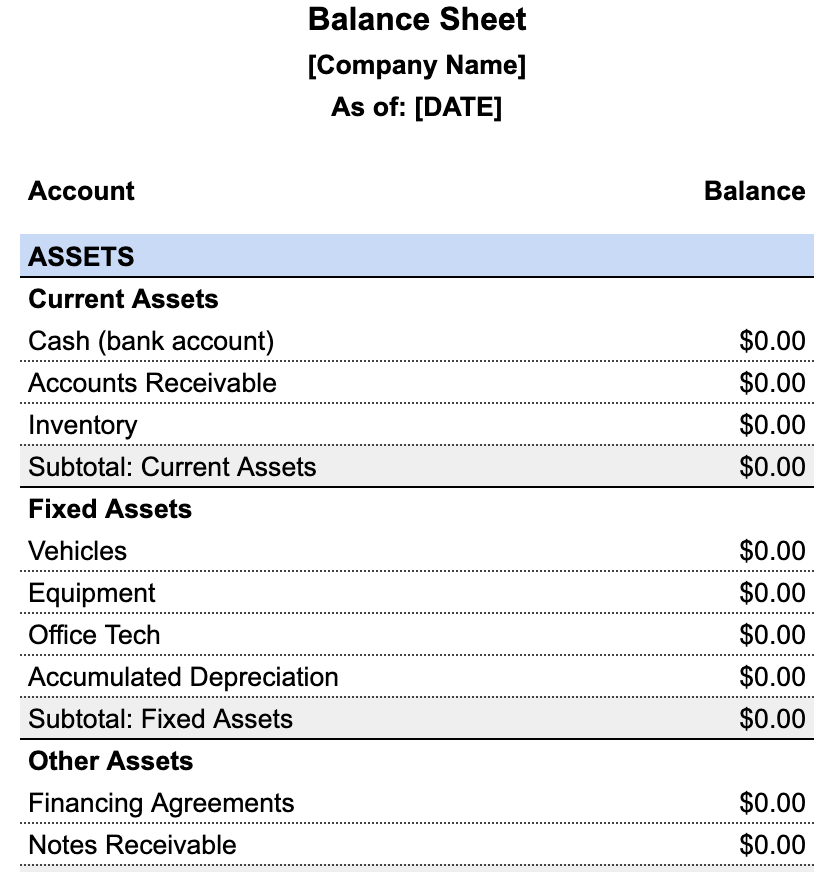
The Balance Sheet is like a snapshot of a company's financial health at a specific point in time, it shows you what they own (meaning assets), what they owe (liabilities), and the difference between the two (net worth), or in other words, it's like a financial x-ray.
Cash Flow Statement is like a map of a company's cash flow, it shows you where the cash is coming from, such as operating, investing, and financing activities, and where it's going. So it’s like tracking your bank account to see where your money went.
Price to Earnings Ratio and Market Cap are also important indicators of a company's financial health and potential for growth. The P/E ratio, or price-to-earnings ratio, compares a company's stock price to its earnings per share. A lower P/E ratio generally means the stock is undervalued, while a higher P/E ratio means it may be overvalued.
Market capitalization, or market cap, is the total value of a company's outstanding shares of stock. A company with a higher market cap is generally considered to be more financially stable and have more potential for growth.

PB University LITE Class List
1) Trading Terminology
2) Stock Market Indices
3) Common, Preferred, and Penny Stocks
4) Diversification of Assets
5) Fundamental Analysis Made Easy
6) Technical Analysis Made Easy
7) Risk Management In The Market
8) Portfolio Management
9) How To Follow Market News
10) Trading Psychology
11) Options Explained
12) The Greeks In Options Trading
13) How To Short Sell Options
14) Covered CALLS
15) Spread Trading
16) Online Brokers for Options Trading
17) Implied Volatility Calculators & Tools
18) Protective PUTS
19) Iron Condors
20) Straddles
21) Reading Level 2
22) Taxes
23) Trading Psychology Techniques
24) The Art Of Trading
25) Becoming A Jedi In The Stock Market
26) Futures Trading Explained
27) Commodity Trading 101
28) Regulatory Environments
29) How To Become A Millionaire
30) $100K In 100 Days
31) Wash Sale Rule
32) Behavioral Finance Part 1
33) Behavioral Finance Part 2
34) 5 Charting Indicators
35) Fair Value Gap
36) Insider Trading and Market Manipulation
37) Stock Chart Types
38) Moving Averages 101
39) Base vs Precious Metals
40) Electricity Trading 101
41) Trading Brokers 101
42) 5 Trading Strategies
43) 85% Trading Rule
44) Are Win Rates A Scam?
45) Futures Trading 101
46) ATR Indicator Strategy With The Greeks
47) MACD Indicator 101
48) Bollinger Bands Indicator 101
49) Wedges, Triangles, Flags and Pennants
50) RSI Divergence 101