Technical Analysis 101
I’m Meta Matt, Director of Education and welcome to PB University LITE! This is a 50 Class Trading 101 Series geared towards both new and veteran traders alike! We go over everything from Trading Psychology, Technical Analysis, and Options Trading to Commodity Trading, Forex, and more!! This 50 Class series is not designed be taken in order, it is instead designed for traders to browse and pick which classes interest them. I will include the list of classes at the bottom of this page.
Start Trading With Webull: Free Stock Shares
Custom Trading Indicator DISCOUNT: Try StocksBuddy Today
Get A Trading Coach, Premium Alerts, Education, and Community:
1 Month Membership
90 Days (Save 10% Per Month)
1 Year (Save $279)
Before we start, let me just say that Technical Analysis is not a crystal ball, it's more like a weather forecast, you can't predict the future but you can have an idea of what's coming. Technical Analysis is interpreting trends and important price levels by analyzing statistics generated by the past activity of an asset, such as past prices and volume. It's like trying to predict the weather by looking at yesterday's forecast. Just like the weather, the stock market can be unpredictable, but with technical analysis, we can at least try to identify patterns and make educated guesses.

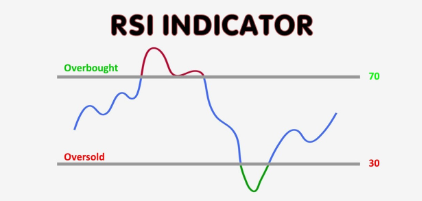
Let’s start with the RSI or Relative Strength Index which is a momentum indicator that compares the size of recent gains to recent losses in an attempt to determine overbought and oversold conditions of an asset. It ranges between 0 and 100. Generally, an RSI above 70 is considered overbought and an RSI below 30 is considered oversold. Let's say you're looking at a stock's chart and the RSI is at 90, so you decide not to buy it because the stock is considered overbought, this would be like when you see a shirt at the mall that's $20 more expensive than it was a week ago, so you decide to wait for a sale.
Next up is moving averages, which are a very popular indicator in charting that helps smooth out fluctuations (or noise) in a stock's price action. Meaning it helps you look past the sharp moves up and down, so that you can see the big picture. There is the Simple Moving Average (SMA), and Exponential Moving Average which gives more weight to recent data, and is known as the EMA.
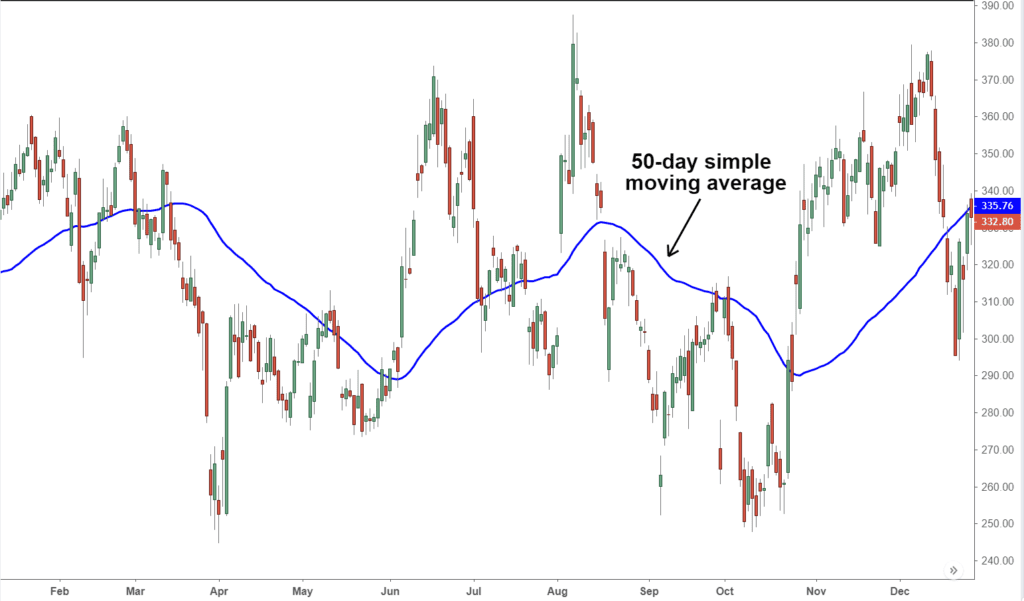
So let’s say you have a field of apple trees. And you picked apples each day for the past 100 days, and you have 200 apples. That means you averaged 2 apples per day, for the past 100 days. But let’s say that out of those 200 apples, half of them, so 100 of them, were picked during the past 20 days. That means you picked 100 apples in 20 days, meaning an average of 5 apples per day. Your 20 day average is 5 apples per day, and your 100 day average is 2 apples per day. Because your 20 day average is higher than your 100 day average, one can assume that apple production in your apple field has been going up recently and is on an uptrend. In the same sense if you're looking at a stock's chart and the 20-day moving average is above the 100-day moving average, that could mean that the stock is also on an uptrend.
These are just two of the many indicators out there. No one indicator should be used alone, as they can’t predict the future.

PB University LITE Class List
1) Trading Terminology
2) Stock Market Indices
3) Common, Preferred, and Penny Stocks
4) Diversification of Assets
5) Fundamental Analysis Made Easy
6) Technical Analysis Made Easy
7) Risk Management In The Market
8) Portfolio Management
9) How To Follow Market News
10) Trading Psychology
11) Options Explained
12) The Greeks In Options Trading
13) How To Short Sell Options
14) Covered CALLS
15) Spread Trading
16) Online Brokers for Options Trading
17) Implied Volatility Calculators & Tools
18) Protective PUTS
19) Iron Condors
20) Straddles
21) Reading Level 2
22) Taxes
23) Trading Psychology Techniques
24) The Art Of Trading
25) Becoming A Jedi In The Stock Market
26) Futures Trading Explained
27) Commodity Trading 101
28) Regulatory Environments
29) How To Become A Millionaire
30) $100K In 100 Days
31) Wash Sale Rule
32) Behavioral Finance Part 1
33) Behavioral Finance Part 2
34) 5 Charting Indicators
35) Fair Value Gap
36) Insider Trading and Market Manipulation
37) Stock Chart Types
38) Moving Averages 101
39) Base vs Precious Metals
40) Electricity Trading 101
41) Trading Brokers 101
42) 5 Trading Strategies
43) 85% Trading Rule
44) Are Win Rates A Scam?
45) Futures Trading 101
46) ATR Indicator Strategy With The Greeks
47) MACD Indicator 101
48) Bollinger Bands Indicator 101
49) Wedges, Triangles, Flags and Pennants
50) RSI Divergence 101


