Case 1: Bear Market
To every market participant that has been involved in crypto for a while, it is probably very obvious that we find ourselves in a bear market.
In order to properly make money in a bear market it is essential to have downside targets (either to short to or to dollar cost average into the market).
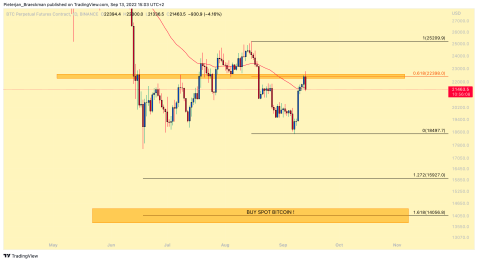
After capitulating on June 18th to the level of 17.6k, we essentially up-trended to the key resistance level at 25.2k (which was the previous wick low from the Luna liquidation event), from which we formed (as of right now) a higher low at 18.4-18.5k.
Taking Fibonacci retracement levels to 25.2k from 18.4-18.5k, we see that the key level in the market is 22.4k (take notes).
If we close a daily candle above 22.4k, it is going to look very bullish for Bitcoin and we will likely find ourselves in the BULL scenario.
However, holding 22.4k as resistance, is going to put more pressure on the lows Bitcoin, essentially looking to break them and keeping in us a BEAR scenario.
So for Bitcoin once the level of 18.4-18.5k breaks, it will, in my mind, look for continuation to the downside, sweeping the 17.6k low.
Targets = 16k and 14.1k.
Case 2: Bull Market
Whether we bottomed out for Bitcoin, on June 18th, is still very much unclear. However, some aspects in the charts tell us that we very well may have bottomed out indeed.
On September 7th, Bulls protected the June 18th low successfully, essentially forming a higher base at 18.4k.
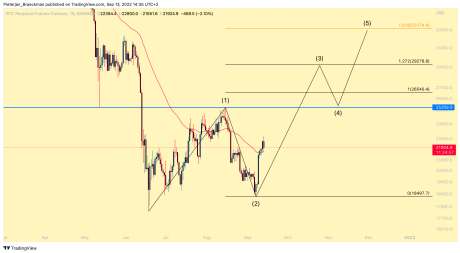
The holding of a higher low, gives confluence to the fact that we may be in a 5 wave Elliot move to the upside right now for Bitcoin.
How does this work?
The 5 wave Elliot move essentially gets activated by an initial impulsive move. This move is our wave 1, which, for BTC, got us from 17.6k to 25.2k.
The wave 2 of this 5-wave count needs to hold a higher low than the start of the wave 1 impulse, which, if we take a look at the chart here on the daily timeframe for Bitcoin, we can see that we clearly did that. Wave 2 retraced to 18.4k, which is, of course, a higher low than the start of the wave 1 impulse at 17.6k.
Assuming that we have made our wave 2 correction, we could assume that we find ourselves in the wave 3 of the 5 wave move up right now.
Important characteristics to know about the wave 3: it is always a more impulsive wave than the wave 1, meaning, we can see some exponential upside here for Bitcoin in the coming days and weeks.
A very accurate tool to give us levels as to where the wave 3 can end up, comes from using the “trend based Fibonacci tool”, taking it from the low of wave 1, to the high of wave 1, to the low of wave 2.
Minimal target for wave 3 = 26.5k - Median target for wave 3 = 29.3k and an upper target for wave 3 would come at around 33.2k.
If the 5 wave move to the upside holds through, it means that in any case, we will break the MAJOR resistance at 25.2k.
After wave 3, we wil find ourselves in yet another corrective wave, namely wave 4.
The trick and rule with wave 4, is that it MAY NOT retrace deeper than the wave 1 high (which is 25.2K).
So in the future if we see a successful wave 3 the upside, we already know in advance, that the following correction should not come lower than 25.2K. If it does, this will simply invalidate that we are in a 5 wave move to the upside.
Providing we hold 25.2k on the wave 4 retracement, however, we will be looking at a final 5th wave, before coming in for a deeper correction.
The levels as to where wave 5 could come, are not yet clear, before we can assess where that wave would take us, we need to see the finalization of waves 3 and 4.