JUNE 29 - July 3, 2026
Major Market Notes
Last week: Tech sold off hard, with the Nasdaq down about 4.6% and the S&P 500 off roughly 2%, while value, small caps, and defensives gained as money rotated out of mega-cap AI names.
Apple and Microsoft both fell on price-hike news, oil dropped near $70, and the Fed has now taken 2026 rate cuts off the table.
This weekend: Markets were closed, but big funds like Ackman's Pershing Square reportedly added to Amazon as a value play against pricier AI peers, reinforcing the rotation theme heading into quarter-end.
Next week: A holiday-shortened, jobs-heavy week with markets closed Friday for July 4th. Watch June nonfarm payrolls Thursday (114K expected vs 172K prior) plus JOLTS, ISM, and ADP, with Nike, Constellation Brands, and General Mills headlining earnings.
Events & Livestream Schedule

Upcoming Earnings Releases

Economic Calendar

Broad Market Analysis
/SPX500USD: SP500

- The SP500 continued lower last week, with a bearish engulfing candle after the SP500 rejected off of $7500 and closed right near $7350 support to end the week.
- For this week, if $7350 can hold as support, look for a move higher to retest $7400/$7500/$7600 in the future.
- If $7350 cannot hold as support, look for a move lower down to $7200/$7030/$7000 in the future.
$S5FI: SP500 Stocks Above 50-Day Average

- Short term breadth closed right at 65% resistance after it held support at 55% to end the week last week.
- With that, if 65% can be broken, look for a move higher to 75% in the future.
- Anything above 75% and expect a move to 80%/85%/90% in the future.
- If 65% cannot be broken, look for a move down to 55%/45% in the future to test the lows of trend.
$S5TH: SP500 Stocks Above 200-Day Average

- Long term breadth also moved higher, which is interesting considering the SP500 moved lower last week.
- With that, 60% resistance was broken, so as long as it holds in the future, expect a retest of 65%.
- If 65% can be broken and held as support, look for a move to 70%/75% in the future.
- If 60% cannot hold as support in the future, expect a move lower down to 52.50%/50% and potentially lower in the future to the lows of trend near 45%/42.50%.
$US30: Dow Jones Industrial Average

- The Dow put in a bullish engulfing candle last week, with it continuing to make all time highs that it can’t hold week after week.
- With that, as long as $50000 holds as support in the future, look for the Dow to continue higher up to $52000/$52500/$53000/$53500-$53630 in the future.
- If $50000 cannot hold as support, look for a move lower down to $49000/$48000/$47000/$46000/$45000 in the future.
$IXIC: Nasdaq Composite

- The Nasdaq got rejected off of the -0.382 last week, with a bearish engulfing candle to close below $26350 for the week.
- With that, as long as $26350 remains as resistance, look for a continued move lower down to $25000/$24000/$23750 in the future.
- If $26350 can be broken and held as support, look for a move higher to $27000.
- Anything above $27000 and expect a major move higher to $27500/$28000/$28500/etc.
$US2000: Russell 2000

- The Russell also put in a bullish engulfing candle last week, with a proper breakout above $3000 to end the week.
- For this week, if $3000 can hold as support, look for a move to $3050/$3100/$3150/$3200 in the future.
- If $3000 cannot hold as support, look for a move to $2900.
- Anything below $2900 and expect a move to $2750/$2730 in the future.
$VIX: Volatility Index
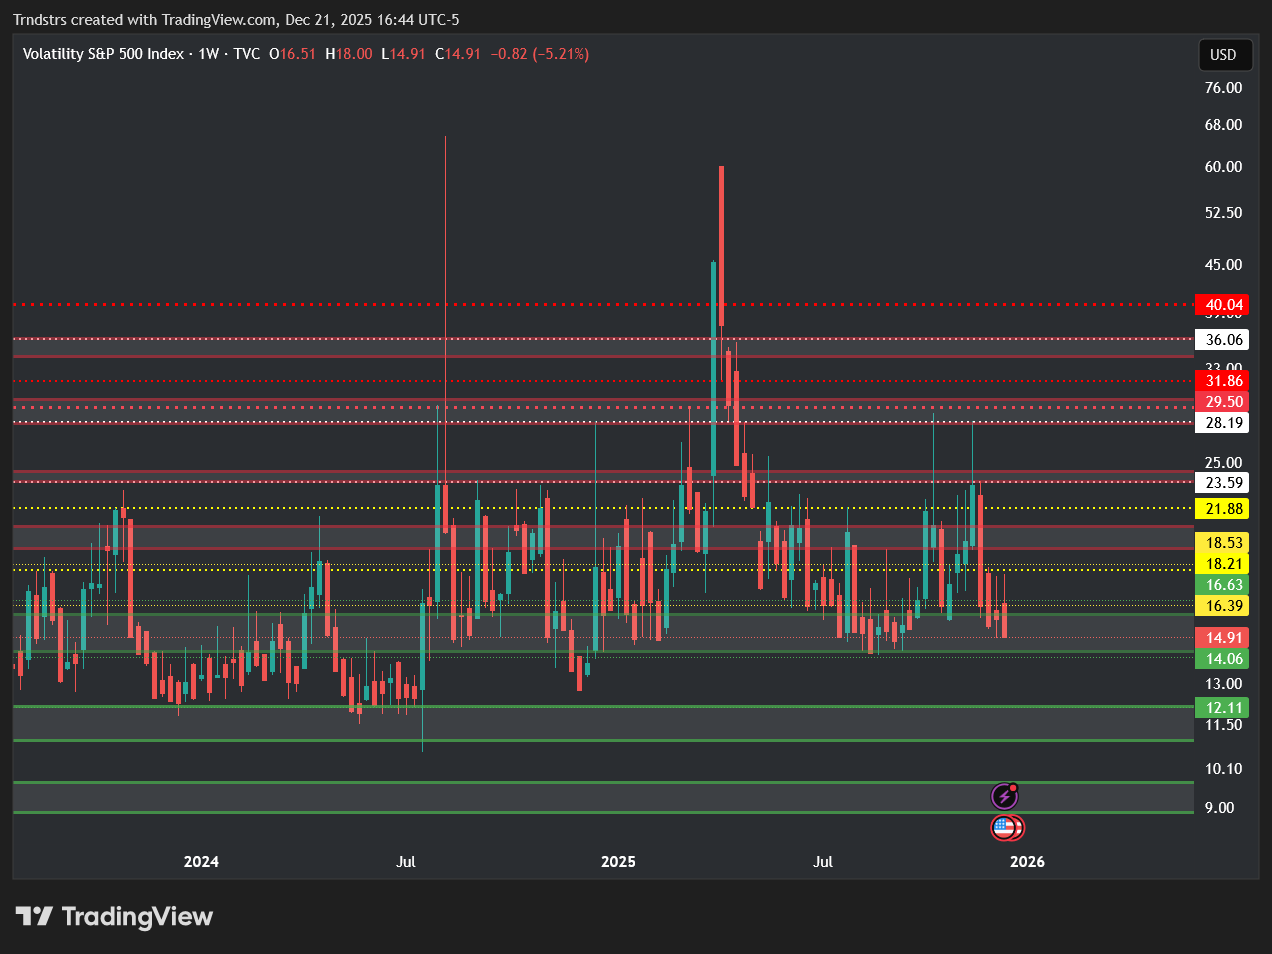
- The VIX closed above $18 last week after it continues to manage to hold the support zone between $14-$16.
- With that, if $18 can hold as support, look for a move to $20/$23.50.
- Anything above $23.50 and expect a major move higher to $25/$27.50/$30 in the future.
- If $18 cannot hold as support, look for a move lower down to $16/$14 in the future.
$XAUUSD: Spot Gold

- Gold tapped $4000 for the first time last week and had a nice reaction off the level to say the least.
- With that, if $4000 cannot hold as support in the future, look for a move lower down to $3750/$3500/$3250/$3000 in the future.
- If $4000 can continue to hold as support, look for a move higher to $4200/$4400/$4500 in the future.
- Obviously $4000 is a very key psychological level, so expect some price action here.
$XAGUSD: Spot Silver

- Silver broke below $65 support last week and put in a new low of trend, with it breaking into the $50’s to close the week.
- If $60/$65 remains as resistance this week, look for a continued move lower down to $54-$55.
- If $54 cannot hold as support, look for a move lower down to $50/$48/$45/$42.50 in the future.
- If $65 can be broken and held as support, look for a move higher to $70/$75 to test major resistance above.
$DXY: US Dollar Index

- The US Dollar broke out above $100 last week and closed above $101 as well to end the week.
- For this week, if $100-$101 can hold as support, look for a move higher to $102/$103.
- Anything above $103 and watch for a move to $104/$106 in the future.
- If $100 cannot hold as support in the future, look for a move down to $98/$96 in the future to test the lows of trend.
$USOIL: Crude Oil

- Crude is sitting right above the key level of support at $67.50, which makes it have some potential for a bounce here.
- If $70 can continue to hold as support, look for a move to $72.50/$75 in the future.
- Anything above $75 and expect a retest of $82.50/$85 in the future.
- If $70 cannot hold as support, look for a move to test $67.50, which is pretty much sitting right at the gap fill.
- If $67.50 cannot hold as support, look for a move lower down to $65/$62.50/$60 in the future to test major support below.
$US02Y: US Government Bonds - 2-Year Yield

- The 2-Year is continuing to get denied here at 4.15%-4.30% major resistance, with a bearish candle to close the week.
- With that, if 4% can continue to hold as support, expect continued retests of the 4.15%-4.30% range.
- Anything above 4.30% and expect a major move higher to 4.50%-4.60% in the future.
- If 4% cannot hold as support, look for a move lower down to 3.80%/3.60%-3.40% in the future.
$US10Y: US Government Bonds - 10-Year Yield

- The 10-Year also got denied last week off of 4.50% resistance, with a move lower to end the week.
- With that, if 4.50% remains as resistance, look for a move to 4.20%-4.30% in the future.
- Anything below 4.20% and expect a move to 4.10%/4%/3.90% in the future.
- If 4.50% can be broken and held as support, look for a move to 4.60%.
- Anything above 4.60% and expect a move to 4.80%/5% in the future.
Get Three In-Depth Research Reports Every Month
Rest & Retire provides busy investors with three in-depth research reports directly to your inbox every month.
Technical Analysis
$AMD: Advanced Micro Devices
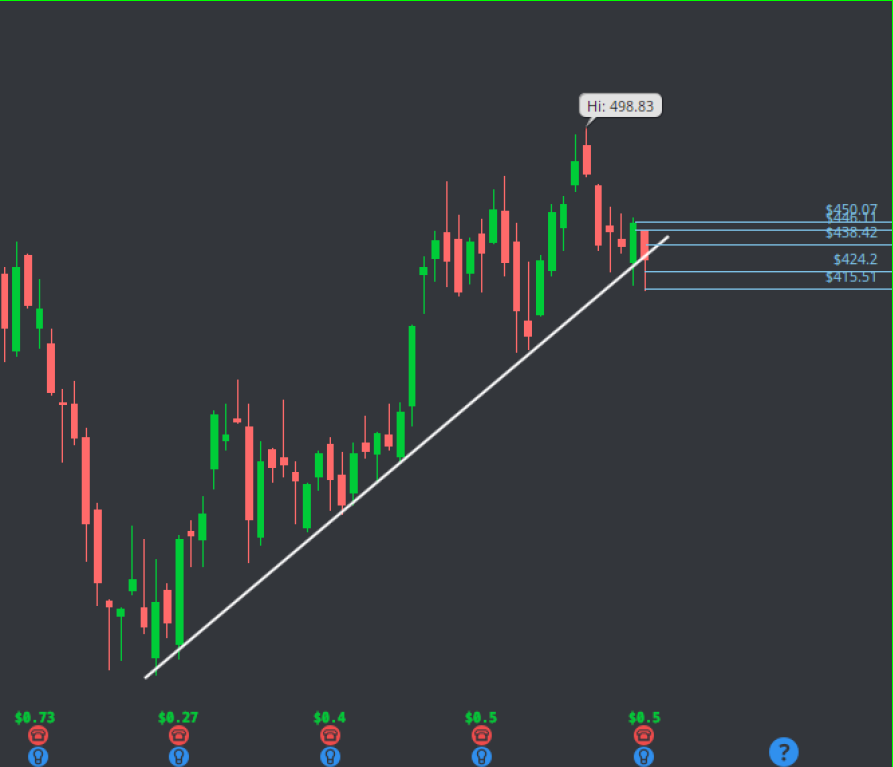
- This daily consolidation stands out on the daily chart! After hitting $563 all time highs last week, it has been holding up well and $500’s is a key level to keep on watch.
- The plan is very simple here for longs, as long as it manages to hold $502.61, and accepts over $523 - $AMD has room to $543.93, $563.
- Over this, we have no levels but could use psych levels to $570, $575 and $580.
- If $AMD fails to hold $502.61, we could see a larger pullback down to $480, $464.63, $447.1, and $428.04.
$SNOW: Snowflake
- Snowflake without a doubt has been so strong after they reported earnings in May.
- After the report, it managed to gap up and retest an area from November of 2025.
- If we take a look at the weekly chart, the weekly looks like it could potentially pivot after triggering weekly buys.
- A key level that I have on watch is $251.37, and I believe that if we can get acceptance over this level, we could retest $284.99 in the near future.
- For longs, I am specifically looking for holds of $235.93, and acceptance over $251.37 with targets to $265.45, $282.71, and $295.
- If $235.93 fails to hold, we could see structure change and could see lower down to $223, $214.21, and $208.96.
$MRP: Millrose Properties
- I found this name from another analyst in the space, so if you know who I’m talking about, then credit is theirs, and if you don’t, then don’t sweat it.
- Looks like $MRP saw acceptance above a beautiful bull flag on the weekly chart last week.
- We’re looking for acceptance above $30.75 for potential level retests near $31, $31.7, $32.50, and $33.
- The ultimate target looks like $36 at the moment, but if we’re testing that this week, then we just might start looking for $40 if not higher.
- Fair warning, this week could be choppy if it’s just an inside bar setting up for a 1-2-3.
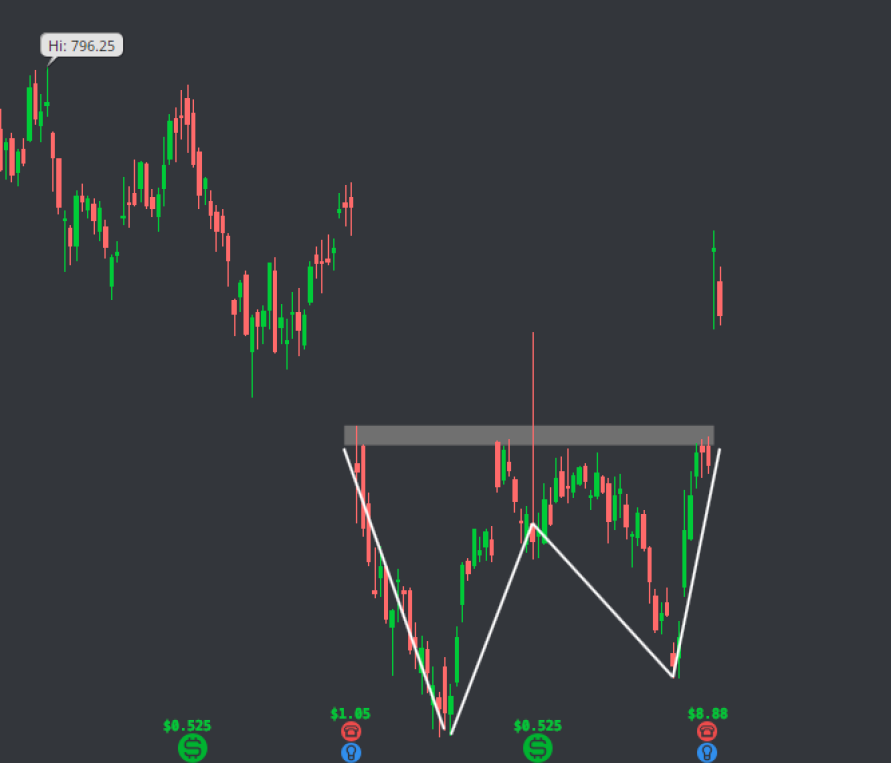
$CMG: Chipotle Mexican Grill
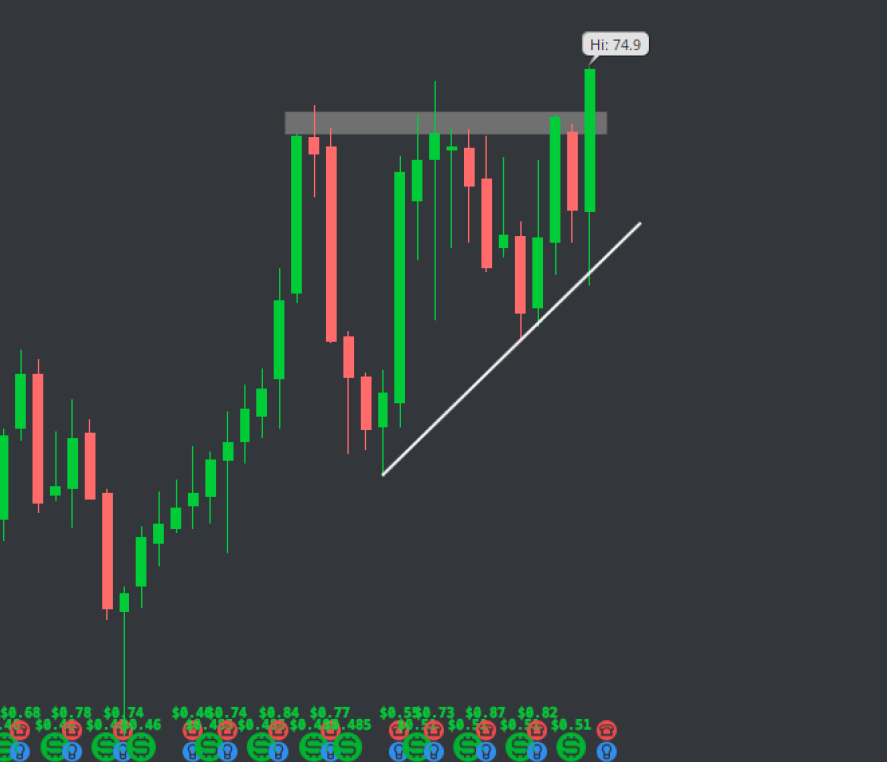
- We were looking at CMG earlier this year for a breakout, and we’re finally testing above that trendline again as of last week.
- We’re in between a few levels, but we’re looking for acceptance above $33.50 for a potential move up towards $40.
- We have other areas of resistance before $40.
- We expect some selling near $35.15, $36.20, and $37.
- If we fail this breakout, capitulation below $33 should yield retests near $32.40 and $32, before our final target near $31.25.
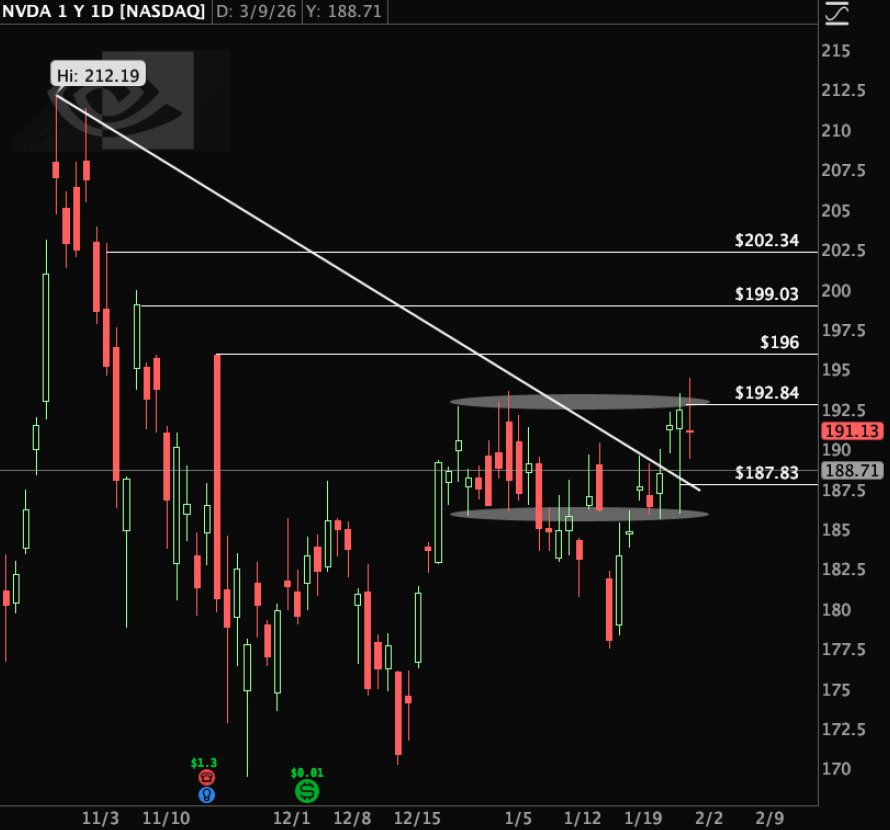
$GOOGL: Google
- I think this pattern still needs some time to develop, but we’re seeing a bit of a bull flag on the Google daily chart, along with a nice failure to go lower, so we’ll go ahead and get this setup out into the atmosphere.
- We could easily bounce here and be near trendline resistance or above it before the end of the week if we see a strong SPY bounce.
- Looking for acceptance over $345 with our targets near $351 and $358.
- We have further targets above that near $361.8 and $367.67.
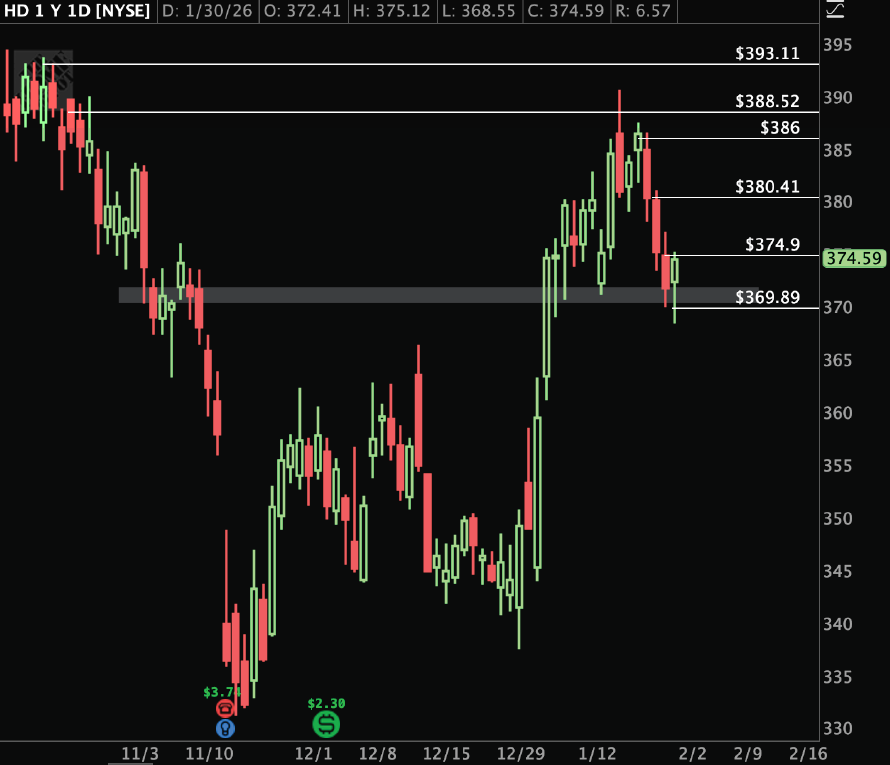
$MSFT: Microsoft
- Throwing MSFT on here due to the weekly candle close from last week.
- Seeing a nice failure to go lower pattern around $360.
- As long as this continues, we’ll look for continued upside momentum on a possible bounce here.
- Acceptance over $376.30 should give us continuation towards $379.7, after which we’d be looking for higher targets near $383.50 / $390.
- If we fail this bounce and continue lower, we’d want to see a clean break below $368 for possible level retests near $357.20 and $351.6.
Get Our Weekly Watchlist
Get the latest market news, stocks to watch, earning reports, exclusive discounts and more!
PB Alerts is a group of experienced traders dedicated to providing hedge fund quality trade alerts without the cost.