Day 1 : Building a Watchlist and explaining the strategy
Day 2 : $PLTR Trade Idea
Day 3: Buying $HOOD
Day 4: Up 5% on $HOOD
Day 5: Entered $UA Trade

Day 6: Trading In Puerto Rico
Day 7: Introducing Beacon
Day 8: S&P 500 Record Highs
Day 9: Robinhood Makes Moves Into Crypto
Day 10: Roaring Kitty Meows

Day 11: $GME Trade Idea
Day 12: $NIO Trade Entry
Day 13: Taking Profits In $HOOD
Day 14: Stopping Out Of $UA
Day 15: Stopping Out Of Everything

Day 16: No FOMO
Day 17: 6 New Trade Ideas
Day 18: Entering $ACB Trade
Day 19: DXY Tells Us To Stay Out Of The Market
Day 20: "Shoulda, Coulda Woulda"

Day 21: $CCL Hits Target 1
Day 22: Trading Psychology Book Club Week 1|
Day 23: $NKE Earnings Play
Day 24: Adding Day Trades To Our Watchlist
Day 25: Learning From Our Mistakes
Day 26: How Our 4H Candle Strategy Works
Day 27: Why I Am Bullish On $TKO
Day 28: Celebrity MemeCoins
Day 29: Stocks Near Our Entry
Day 30: TheStrat
Day 31: Coaching Program Season 2
Day 32: $SWBI's Funky Chart & Lucky $TKO Entry
Day 33: Month 1 Portfolio Review
Bonus: Using TraderSync To Track My Trades For This Account
Interested In Having Jay As A Trading Coach So That He Can Teach You How He Finds These Trades? Click here to get started!

Extended Trading Hours & Adjusted For Dividends Charts
TradingView offers powerful tools to analyze financial instruments, and understanding how to use them effectively is crucial. Two key features you might encounter are Extended Trading Hours and Dividend Adjustments. Let's break down the purpose of each and how they impact your chart:
Extended Trading Hours:
- Focus: Shows trading activity before and after the standard market hours.
- Benefit: Provides a more complete picture of price movements, especially for volatile assets or those traded in international markets.
- Drawback: Extended hours data may be less liquid (fewer trades) and more volatile compared to regular trading hours.
Adjusted for Dividends Charts:
- Focus: Accounts for dividend payouts by reflecting the reduced share price after the distribution.
- Benefit: Offers a clearer picture of a company's underlying performance by considering both price changes and dividend income.
- Drawback: Not all platforms offer dividend adjustments, and the feature might not be available for all assets.
Choosing the Right View:
The best chart view depends on your trading goals:
- For short-term analysis: If you're focused on intraday trading and want to capture all price movements, including pre- and after-market activity, use Extended Trading Hours.
- For long-term analysis: If you're interested in an asset's overall performance and total return (including dividends), use the Adjusted for Dividends chart.
TradingView Tips:
- Access Extended Trading Hours by clicking the "Ext" button on the bottom right of the chart or through the symbol settings.
- Enable Dividend Adjustments by clicking the "ADJ" button (if available, mobile doesn’t typically have the option) on the bottom panel of the chart.
- TradingView also offers historical dividend data and earnings calendars to help you stay informed about upcoming events that might impact the price.
By understanding the differences between Extended Trading Hours and Adjusted for Dividends charts, you can leverage TradingView's capabilities to make informed trading decisions. Season 2 of our coaching program will have a focus on the brokers and technology our coaches use, and how they use them.
Which Do We Use For Our $500 Account Strategy?
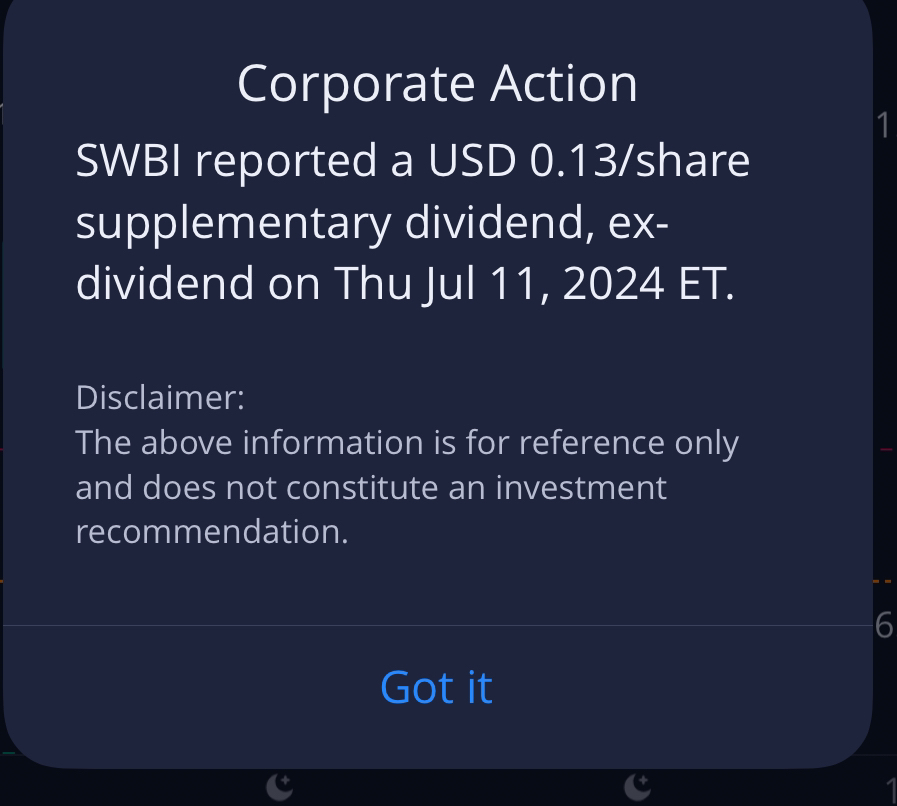
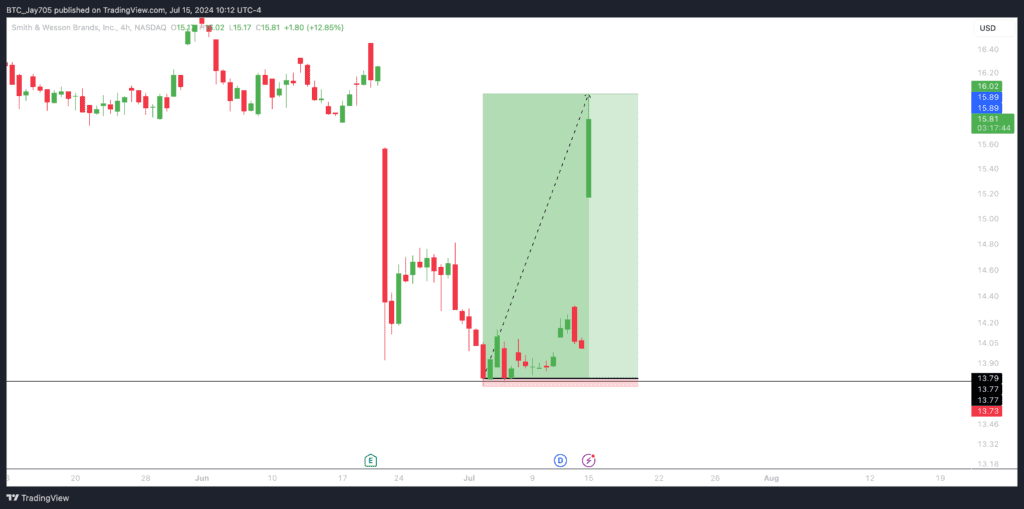
So in our $SWBI trade idea hit a snag when they had a supplementary dividend which changed the chart prices for us.
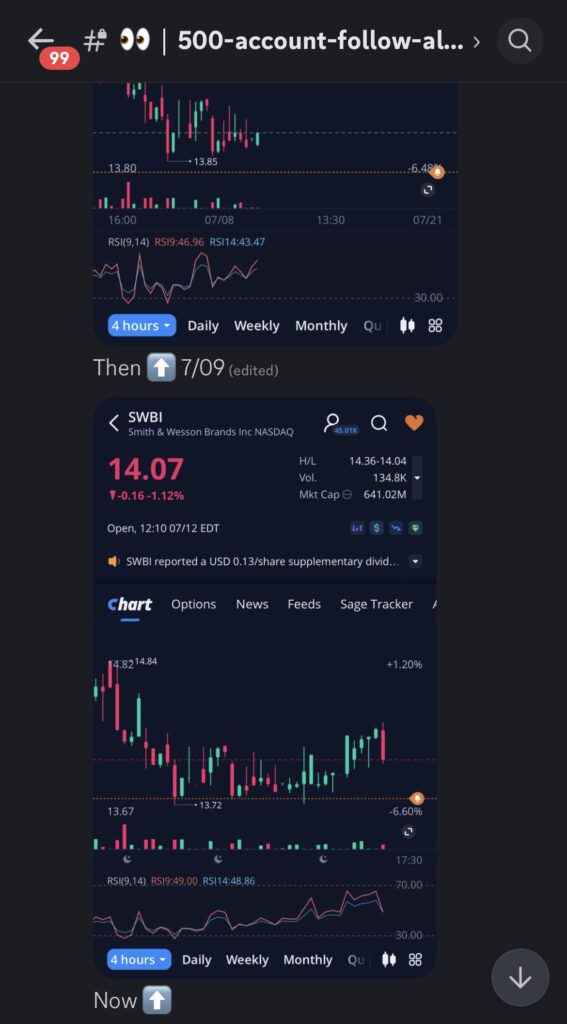
As you can see above, the price for $SWBI adjusted by $0.13. That low on 7/02 of $13.85 turned to $13.72. I was surprised when I woke up and looked at the $SWBI chart (which I knew hadn’t broken below our $13.77 entry level since we put out the trade idea) and saw that the price had broken below $13.77 on 7/02 (after we put output our trade idea). This means that $SWBI broke below $13.77 and had a 4H candle close back above, meaning it hit our entry on 7/02 and I missed it. I thought I was going crazy, as I had screenshots showing that on 7/02 the price hit a low of $13.85, not $13.72. Turns out it was because of a supplementary dividend of $0.13 (which is the difference between $13.85 and $13.72).
I asked one of our analysts’ PookiesRevenge about the charts, and he showed me that the low of $SWBI for him also showed $13.85. I decided to go by that number.
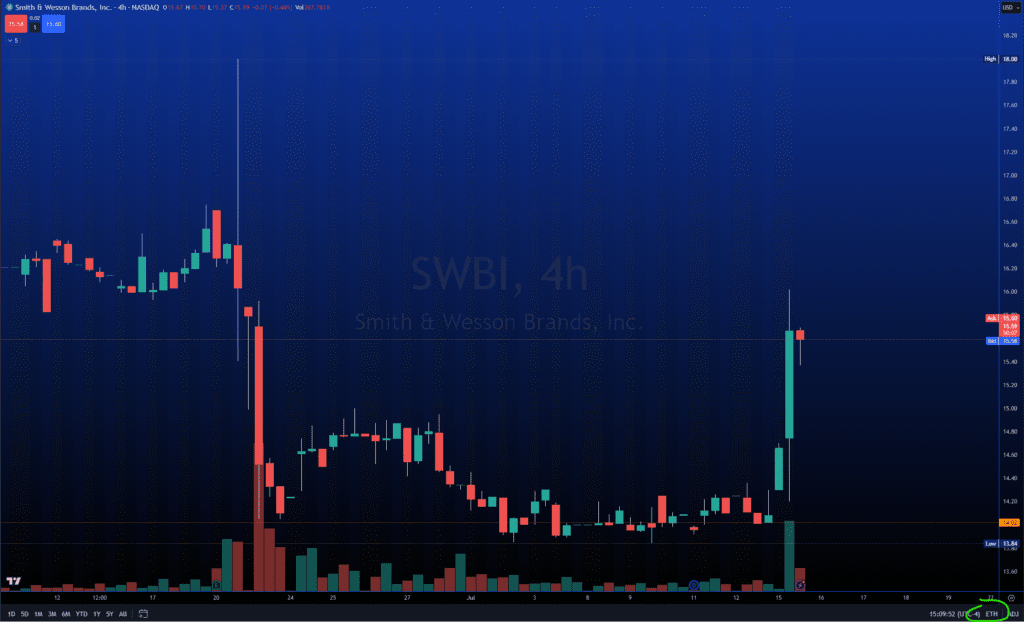
Since I was going by my TradingView chart, which looked like the chart above, that meant that $SWBI hadn’t broken below $13.77, and was not at entry.
It turns out Jay (who teaches the strategy we are using for this $500 account challenge) uses a different chart setting than PookiesRevenge. Jay’s settings are Regular Trading House (not extended trading hours) and Dividend Adjustments (ADJ) on.
This shows firsthand the importance of having access to your specific trading coach while you’re learning their strategy. That’s why our students strive, because our coaches are around in the discord and host weekly live group sessions. There is even an exclusive group chat for members of each coaching group. This also shows the importance of understanding the technology we use to trade these strategies. Had I asked Jay about this during his group session or in the chat, he would have told me how he sets up his chart, and I would have entered $SWBI last week and be up 10%+ right now on it. Or had I understood ahead of time the technology (chart settings) used for this strategy than I would have been able to entered that trade and made profit. That’s why Season 2 of the coaching program will have a focus on the technology used for each strategy, so that this doesn’t happen to you!!
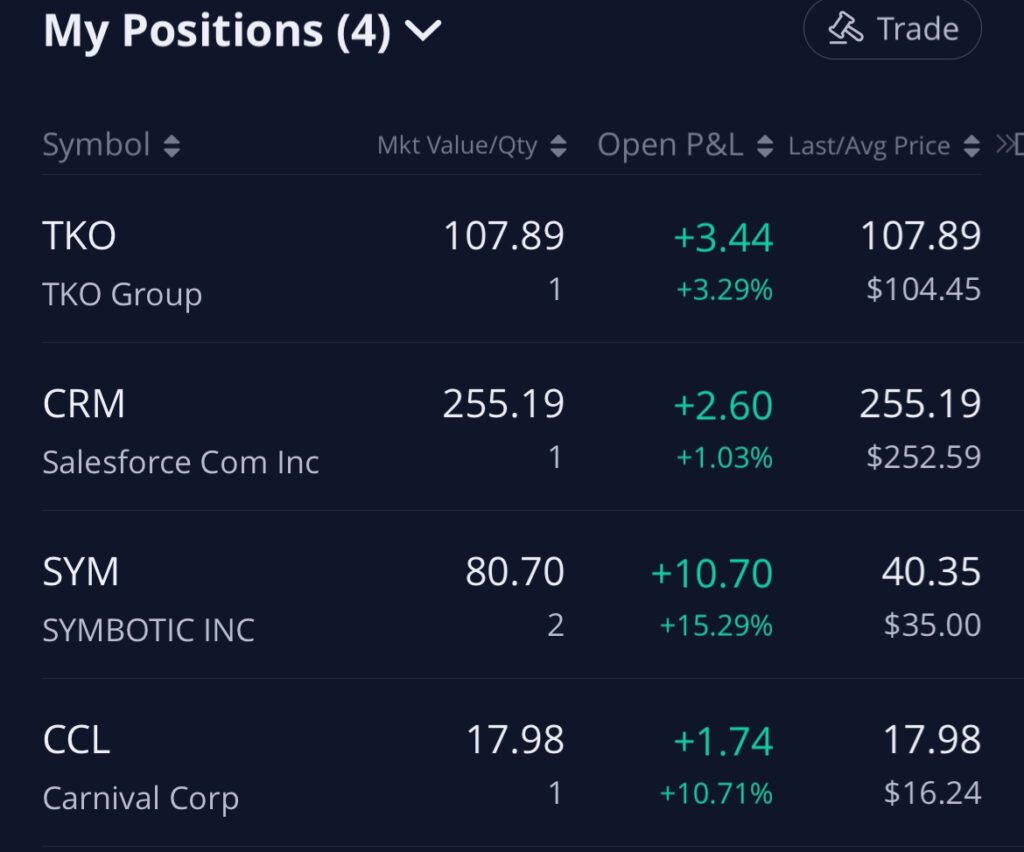
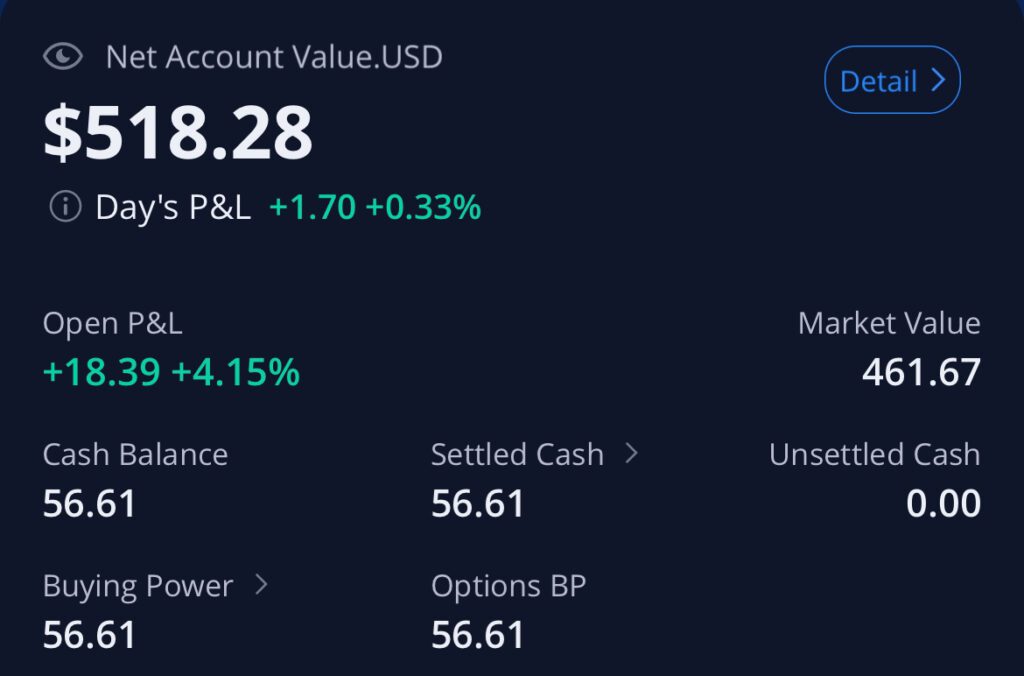
Our open positions are all in the green. We decided to sell 1 share of $SYM to lock in some profits right after taking this screenshot.